
Introduction
As managers, we must constantly make choices about where to apply our resources, which projects take precedence over others, and which of the dozens of demands on our time and attention we respond to. Having a proven method for prioritization in your toolbox can reduce some of the stress and lower the level of noise in your environment.
This article is published as a companion to “Planning Framework Step 3 – Prioritize”. My purpose is to provide a detailed description of two different prioritization approaches that can be used during the Prioritize phase of the Planning Framework. But the techniques described here can be used in many other contexts.
I want to acknowledge two people who helped me with this article. While I was organizing my material, I reached out to two former colleagues at Cummins Inc. for their comments on the methods described below.
Katherine Johnston Sunday is a Digital Business Design Manager. She is also a certified instructor in Human-Centered Design as practiced by the Luma Institute.
Jerry Ames is the IT Functional Excellence and Quality Manager, and a former Six Sigma Master Black Belt.
I appreciate Katherine and Jerry sharing their knowledge and experience with me and, through me, to you.*
A Tale of Two Matrices
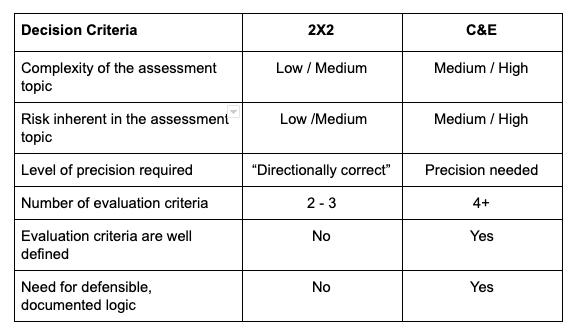
There are two prioritization methods that have produced good results for me. Both use a matrix format to capture ideas and organize them based on predetermined evaluation criteria.
The first method groups items and ideas using qualitative impressions and information, then plots them on a simple 2X2 matrix. I learned this method from Katherine. It is derived from the human-centered design toolbox developed by the Luma Institute. Luma describes human-centered design as “an activities-based way of creative problem solving”. As such, this method is highly visual and interactive. It fits well in workshop settings where prioritization activities might be divided across several small groups of participants. The 2X2 matrix works effectively with ideas and evaluation criteria that are loosely defined, which makes it a good choice for prioritization exercises done early in the planning cycle or in the lifecycle of a program.
Katherine commented that not all groups are comfortable working with this method. If your team is made up of highly analytical individuals, then a more rigorous method, like the one described below, may be more appropriate.
The second prioritization method is more structured and detail-oriented. It uses a Six Sigma tool called a cause and effect (or C&E) matrix. It works well when there are multiple evaluation criteria, clearer definitions and a more precise prioritization is needed.
Jerry told me that because the C&E matrix produces a very distinct, fine-grained prioritized list, it is good for managing a lengthy list of ideas. “It gives you the delineation you need to draw the cut off line in your list”, he said. He also noted that there are multiple ways to extract the priority from the matrix. (More on that below.)
The C&E matrix requires clear definitions for evaluation criteria and scoring, which helps produce a more detailed record of the logic and assumptions used in the prioritization process. Because of this, it is a good choice if you will need to explain or defend your logic.
While they represent different approaches, either of the methods could be used for most prioritization exercises. The decision matrix below provides some guidance to help you decide which of these two methods is most appropriate.
The Test Scenario
In order to demonstrate how the two methods work, we will use a hypothetical scenario, as follows:
- Your organization has had difficulty working with several internal stakeholder groups. To determine how to address the issue, you are conducting a planning framework process with the assessment topic “How do we improve collaboration with our internal stakeholder groups?”
- The time horizon for implementing the improvements is 6 – 12 months from now.
- You have completed the Assess and Ideate phases of the planning framework, and have generated the following list of proposed actions to address the topic:
- Develop a communication package to explain our offerings.
- Survey stakeholders to identify barriers to collaboration.
- Create new role – Relationship Manager.
- Invite stakeholder participation in our planning process.
- Host informal gatherings (lunches, coffees) to promote relationship building.
- Sponsor cross-function education series to learn about each other’s organizations.
- Align performance metrics and KPI’s with stakeholders. (We’re successful if they are successful.)
- Shortly before you begin the prioritization process, during a status update on the planning effort, your Executive VP asks that you add one more proposed action. He wants you to consider building a new “Collaboration Center” in an unused area of your current office campus. You tried to explain that you were focused on a 6 – 12 month time horizon, but he insisted, saying “Just run the idea through the process and see if it fits.” So you have added an 8th item to your list.
The 2X2 Matrix
Step One – Assess Impact
Start with a blank page – a flip chart page on a conference room wall or a blank page in PowerPoint. Draw a line across the bottom and label it “Impact”. Include several bullet points that define what “Impact” means. These are your evaluation criteria. For this exercise, we’ll use:
- Creates value for stakeholders
- Reinforces common processes
- Improves organizational alignment
Make a sticky note (or a small text box in PowerPoint) for each of the items to be prioritized. Place them along the bottom line, left to right in order of increasing impact. Each sticky must have a unique place in the line – no two items can share the same space.
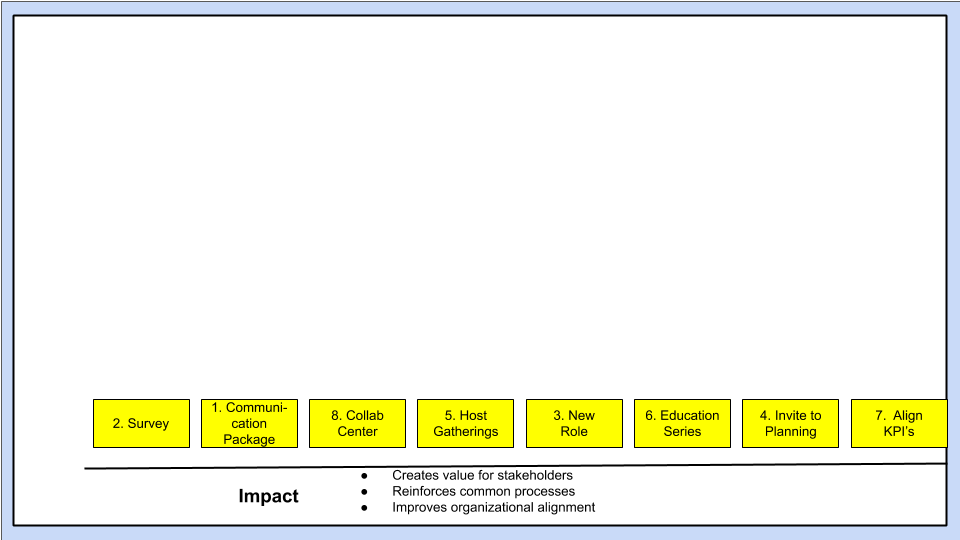
You can expect this step to generate some discussion because it forces the team to make decisions about the level of impact. They can’t hedge and have two ideas occupying the same spot.
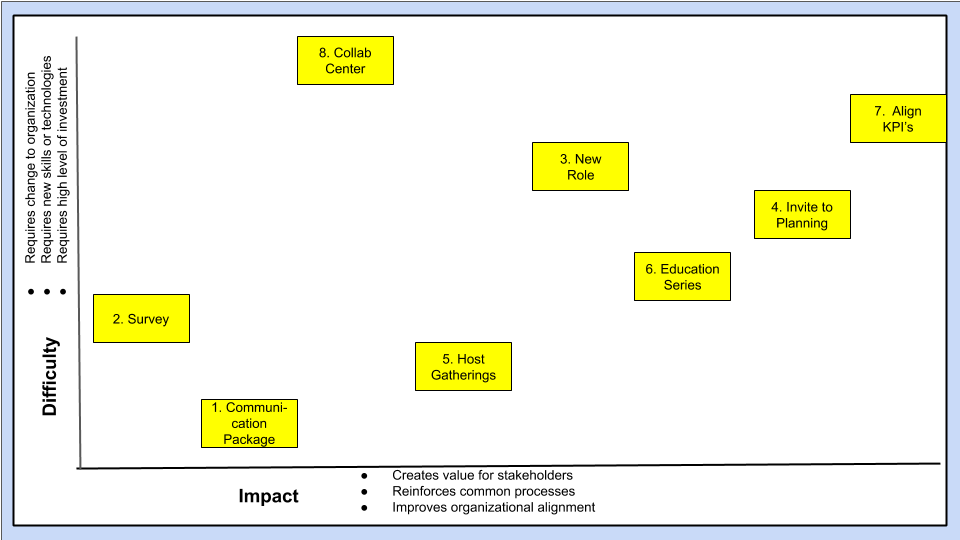
Step Two – Assess Difficulty
Draw a vertical line on the left side of the page. Label it “Difficulty”. Add several bullet points to define your evaluation criteria. We’ll use:
- Requires change to our organization or operating structure
- Requires new skills or technologies
- Requires a high level of investment
Move each of your sticky notes vertically to represent the level of difficulty. Don’t move them left or right. Each note should be at a unique height – no two stickies can be at the same height.
Step Three – Assign Labels
Divide the sheet into a two by two grid by drawing a vertical line at about the midpoint where there are an equal number of notes left and right of the new line. Then draw a horizontal line at the midpoint where there are about the same number above and below the line.
Label the quadrants:
- Upper left: “Nice to have”
- Upper right: “Strategic”
- Lower left: “Quick wins”
- Lower right: “High ROI”.
The items to the right of the line – Strategic and High ROI – are the highest priority items. The two quadrants on the left are not dismissed, but will not take precedence over the others.
Step Four – Sanity Check
The final step is to do a sanity check on the outcome. Ask the team to stand back and evaluate the results. Ask questions like “Does this look right?” Allow time for some discussion, with the ground rule that no notes will be moved during this session.
Some people may object if their pet idea is on the left side of the matrix. They will complain and argue to have their idea moved to the right. Do your best to resist.
Suggest that the team take a day or two to reflect and then reconsider. If, after the reflection period, there is a strong consensus that something should be moved, then move it. Capture the reason for the move in your notes for reference later.
The Quick Wins in the lower left quadrant could be considered “just do it’s” – actions that could be implemented without extensive planning or effort.
The Outcome
In this exercise, we identified four of the eight items as either “Strategic” (High Impact, High Difficulty) or “High ROI” (High Impact, Low Difficulty). Additional work will be required to determine the exact sequence.
As noted earlier, this method is not precise. It identifies which items should have the highest value, and thus should take precedence over the lower value items. This is useful in cases where you want to narrow the list of possibilities before beginning detailed planning.
Bonus Tips
Here are two suggestions to help you get maximum benefit from the 2X2 matrix:
- First, I suggest that you have a scribe present – someone who is not involved in the exercise and can take notes on the discussion. During the deliberations about where the notes fit on the board, good ideas will come out about the definition of each idea, assumptions about them, and interdependencies or conflicts across ideas or with other initiatives. Capturing these thoughts will be useful later as you continue your planning process or communicate the direction to others in your organization.
- Second, if “Impact” and “Difficulty” don’t fit as evaluation criteria, pick something else.
The C&E Matrix Method
As I noted above, the C&E matrix is a tool used in the Six Sigma process improvement methodology. In a typical Six Sigma project, the C&E matrix would be used as part of a sequence of steps to determine the causes of variation in a process. It would have labels like “KPIV” or “KPOV”, which are meaningful in the Six Sigma context, but not helpful for our purposes.
The C&E matrix is very useful when taken out of the Six Sigma project context, as I am using it here. I have modified several of the labels in the C&E template used in this article in order to make their meaning clear. The underlying logic of the C&E matrix, including how the total scores are calculated, is unchanged.
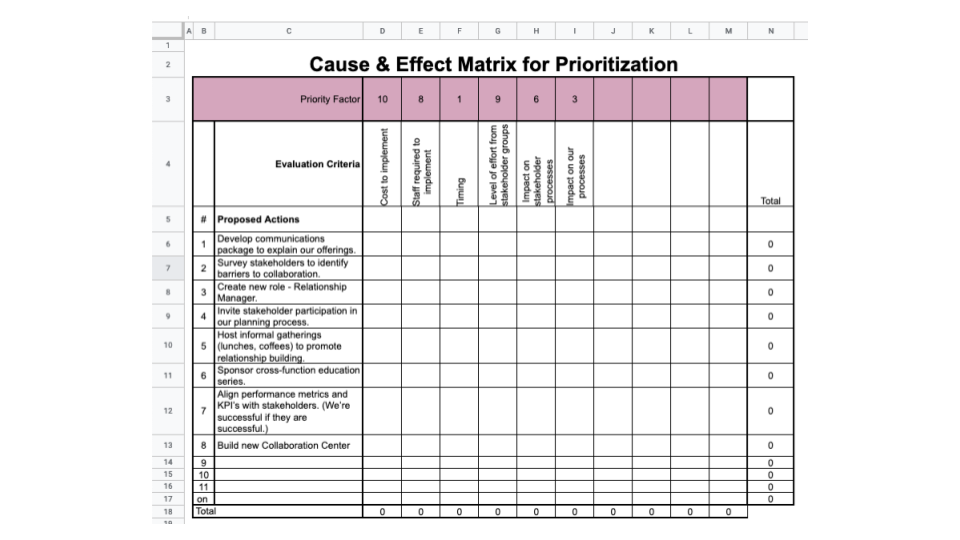
Overview of the Template
Where the 2X2 matrix method uses flip charts and sticky notes, the C&E matrix is a spreadsheet tool. I have created a basic C&E matrix template that you can download. The illustration below shows the major sections of the template.
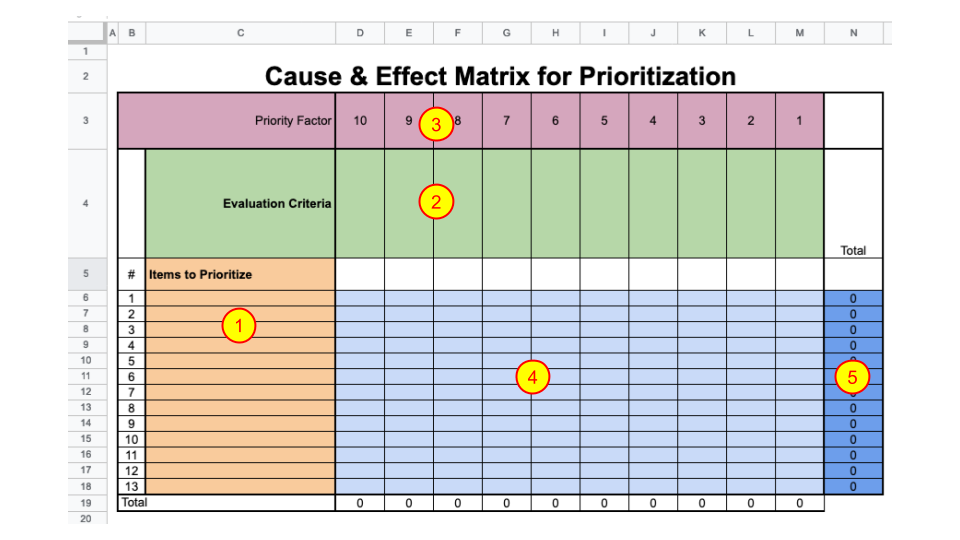
A brief explanation of each section is as follows:
Prioritizing Using the C&E Matrix
To use the C&E matrix as a prioritization tool, you will perform the following steps:
- List the items to be prioritized (Column C)
- Define Evaluation Criteria (Row 4)
- Define the Scoring Values for each Evaluation Criteria (Separate tab)
- Define the Priority Factors
- Score each item
- Sort the worksheet in descending order by Total Score (Column N)
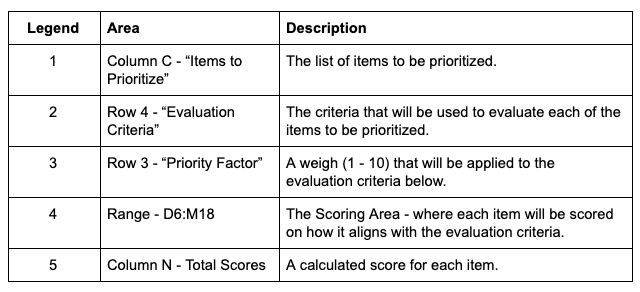
To illustrate how this works, we will use the same scenario as the 2X2 matrix exercise.
List the items to be prioritized in Column C
You begin the exercise by entering the proposed actions in Column C in the worksheet.
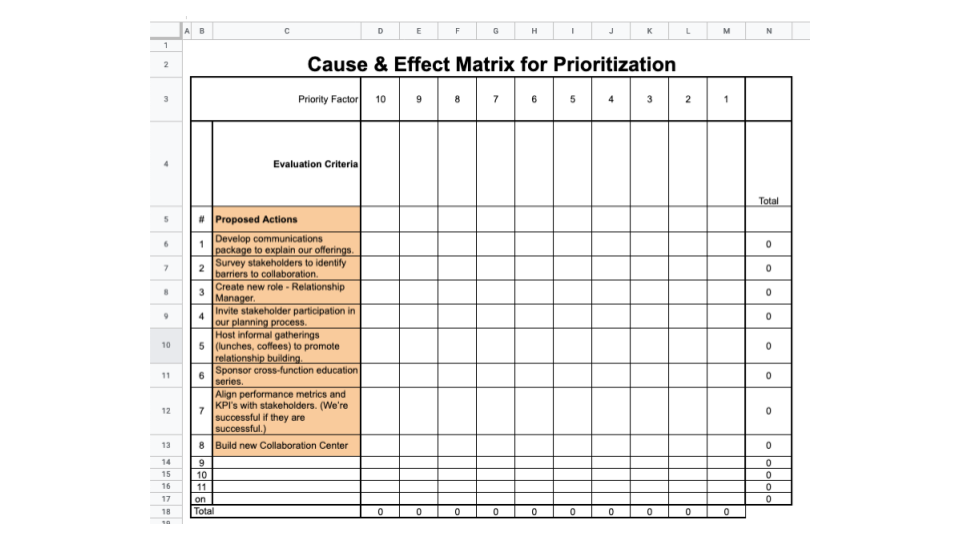
Identify the Evaluation Criteria
Next, you and your team develop a list of criteria to use in evaluating each of the proposed actions. The C&E matrix requires a more precise definition than the 2X2 matrix. For this example, we will identify them as follows:
- Cost to implement
- Staff required to implement
- Timing to implement
- Level of effort required from stakeholder groups
- Impact on stakeholder processes and workflows
- Impact on our processes and workflows
These are entered in row 4, as shown below.
Define the Scoring Values
Next, you spend time with the team developing the detailed scoring table for use in the matrix. For each Evaluation Criteria, you define scores that reflect four variations of how the prioritization items match up.
There are several best practices for defining the scoring values.
- First, use values that are not sequential. In this example, we will use scores 0, 1, 3, and 9. When these are multiplied by the Priority Factor, it creates more separation in the total scores, making it less likely that two items will have the same total score.
- Second, take enough time to do a thorough job and get agreement across the team on the scoring values. A common problem I have seen is that midway through the scoring exercise, a team will start to redefine their scoring table. This can result in inconsistent scoring and will require that the scoring process be repeated.
Assign the scores so that better/worse or greater/lesser are aligned alike. In our example, a score of 0 indicates the worst case (highest cost, longest time) and 9 indicates the best case (lowest cost, shortest time). If these are not consistent, the results will be unusable.
The table below illustrates the scoring values developed for this example:
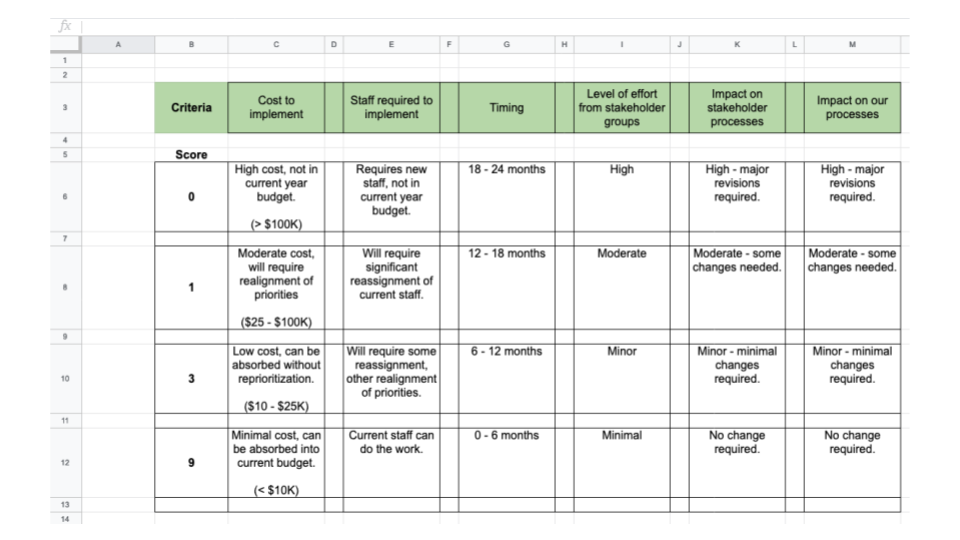
This table is stored in a separate tab in the C&E matrix template, and is kept visible for reference during the scoring activity.
Define the Priority Factors
The Priority Factors are a way to add weight to each of the Evaluation Criteria. You may assign a priority from 1 to 10 (or higher, if you have more criteria) to each of the criteria. Do not use the same criteria twice. You may also skip numbers if you have less than 10 criteria, as shown in our example below.
Score Each Item
Now it’s time to put the matrix to work. You will fill out each cell in the scoring area by assigning a score that reflects how well the prioritization item addresses the evaluation criteria.
For example, on row 6, we have estimated that the cost to develop a new communications package is minor, so cell D6 gets a 9. But developing the package will require that some staff members be reassigned and duties realigned, so cell E6 gets a 3.
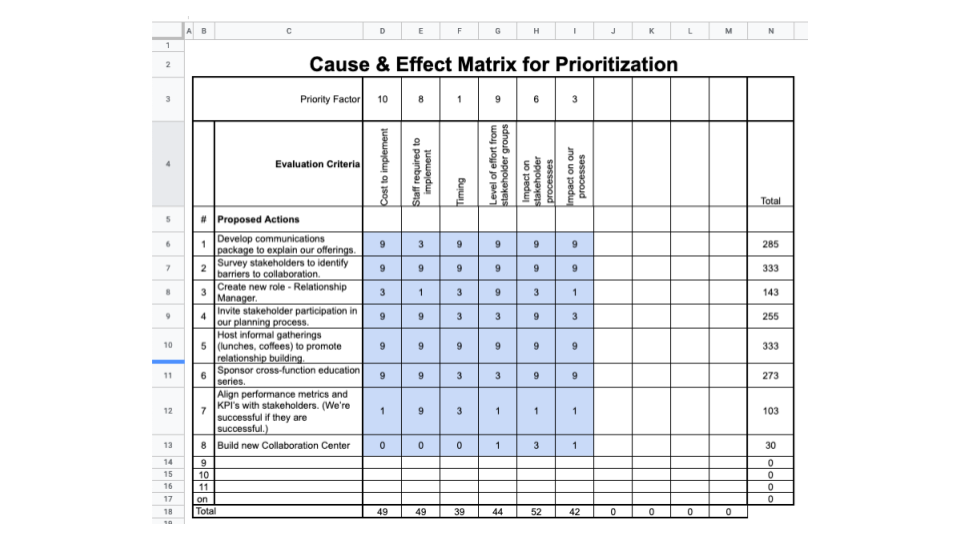
You can proceed through the scoring in different ways. Some teams will work vertically, scoring all items (rows) against a single criteria (column). Other teams may work horizontally, considering all the criteria (columns) against a single item (row).
I have seen some teams start by going through the matrix looking for any cells where the score should be a 9.
My suggestion is that you pick an approach and stick with it, especially if you’re new to the tool.
Sort the Worksheet by Total Score (Column N)
Once you have completed scoring all the cells, sort the results in descending order by the total score (column N). This will put the highest priority items at the top of the list.
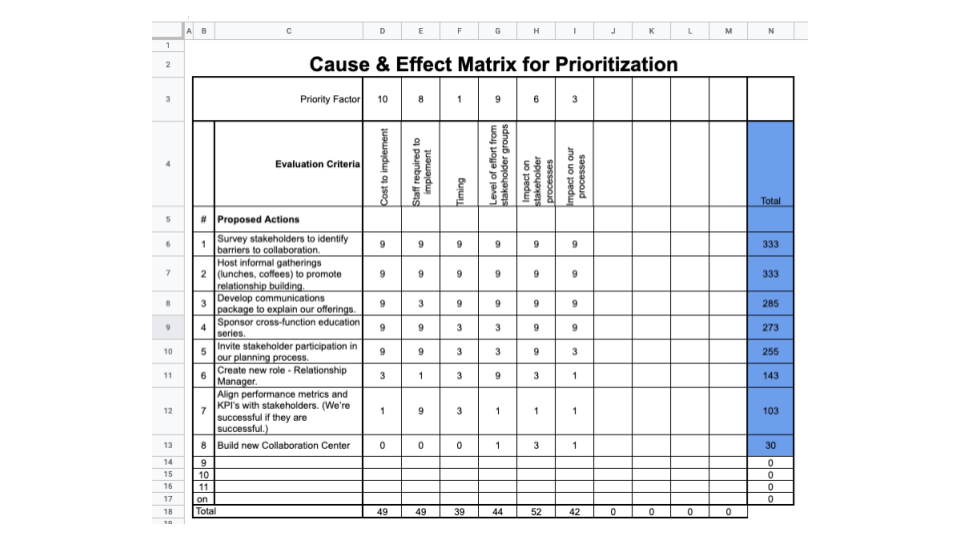
Sanity Check
Just like with the 2X2 matrix, it is useful to do a sanity check on the results of the C&E matrix. Ask the same question: “Does this look right?”
There are two ways to tune the output. If a particular item (row) appears out of place, you can adjust the scoring across that row. If the overall order doesn’t seem right, you can adjust the Priority Factors.
In either case, follow the same cautions as with the affinity exercise – take some time to reflect and reconsider before making changes.
The Outcome
As shown in the last screen shot above, the C&E Matrix produces a prioritized list of all the items entered. In this example, the prioritization reflects the overall level of effort and complexity of the items, with the least effort / least complex ones at the top of the list. This list can now be used as the basis of your planning activity.
Download the C&E matrix template.
Comparing the Two Methods
At the beginning of this article, I said that either of these methods could be used in most prioritization processes. Now that you’ve seen how each one works, you can draw conclusions about the specific scenarios where one might be a better choice.
The 2X2 matrix is useful for getting “big picture” prioritization – sorting a group of possible projects or business initiatives at a very preliminary stage before much is known about them.
The C&E Matrix is useful for dealing with detailed lists, where data is available to support the evaluation criteria.
They do have some characteristics in common:
- They each produce the desired output – prioritized results.
- They are not likely to produce repeatable results. Two different groups using the same inputs would very likely arrive at different results. Results may not be repeatable by the same group.
- Both rely on subjective opinion and human judgement, both of which can be influenced by the dynamics of the team performing the exercise.
That said, the results of our exercise show that it is possible to have similar results from the two methods. See the illustration below.
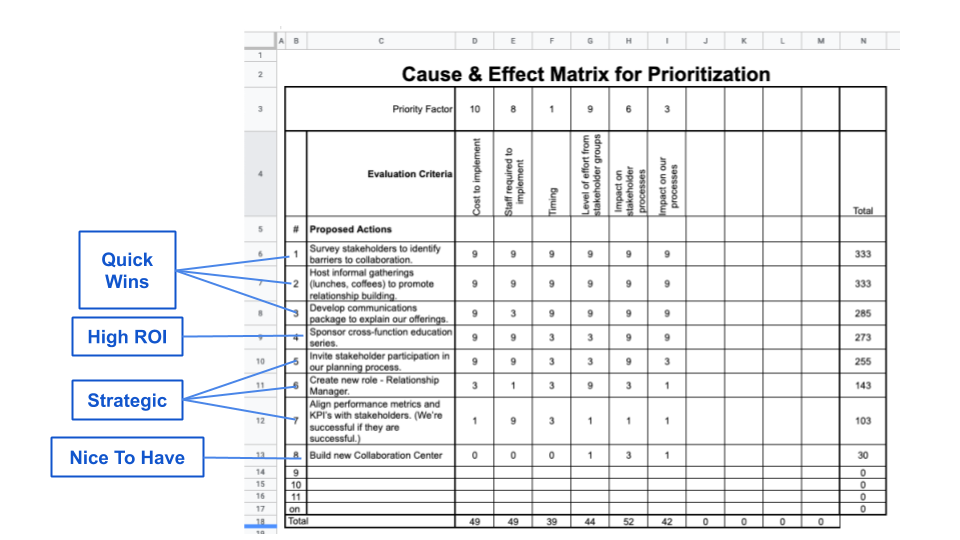
In this example, the C&E matrix result shows the items in order by increasing difficulty. That corresponds to the four quadrants of the 2X2 matrix – with Quick Wins and High ROI being low difficulty and Strategic and Nice To Have being higher difficulty.
Conclusion
Prioritization is an exercise in judgement. As Ron Pereira of the Gemba Academy, a Six Sigma training and consulting firm, puts it, “It’s all opinion.” The 2X2 matrix and the C&E matrix are tools that facilitate capturing the opinions and judgement of your team and ordering them in a manner that provides actionable guidance for your planning efforts.
I hope this article has provided you with a better understanding of the two methods, and that you will find them useful in your own management practice. If you have any questions about either method, please send me a note using the Contact Form, or leave a comment below.
To your success,

Footnotes
* Katherine and Jerry spoke to me as individual subject matter experts in their particular areas. They did not speak as representatives of Cummins Inc.

What’s on your mind today?
Do you have a management problem or question that I could help answer?
If so, then let’s talk.
Click the button below and use the Contact form to request a complementary 30 minute chat. We’ll work together to identify some actionable ideas just for you.